

Updated 21 November 2026 · Based on official MoSPI, RBI and PLFS data · 6 min read
India grew 7.7% last year, one of the fastest rates of any large economy. But that headline hides 36 very different stories. One state produces a seventh of all state output, the south is pulling ahead, and the average person in the richest region earns seven times more than in the poorest.
Here is what the latest official numbers say about India’s state economies, and what they mean.
₹51 lakh cr
Maharashtra’s economy, still India’s largest
10.8%
Tamil Nadu’s real growth, fastest of the big states
7×
Income gap between Delhi and Bihar
15.9%
Youth unemployment, and rising
1. Maharashtra is in a league of its own
Maharashtra’s economy was worth about ₹51 lakh crore in 2025-26, around one-seventh of everything India’s states produce. The gap to second-placed Tamil Nadu (₹35.3 lakh crore) is roughly the size of Telangana’s entire economy.
Below the leader, the top five has been reshuffled. On the latest figures, Karnataka has moved into third place, ahead of Uttar Pradesh and Gujarat. Together, these five states account for about half of all state output.
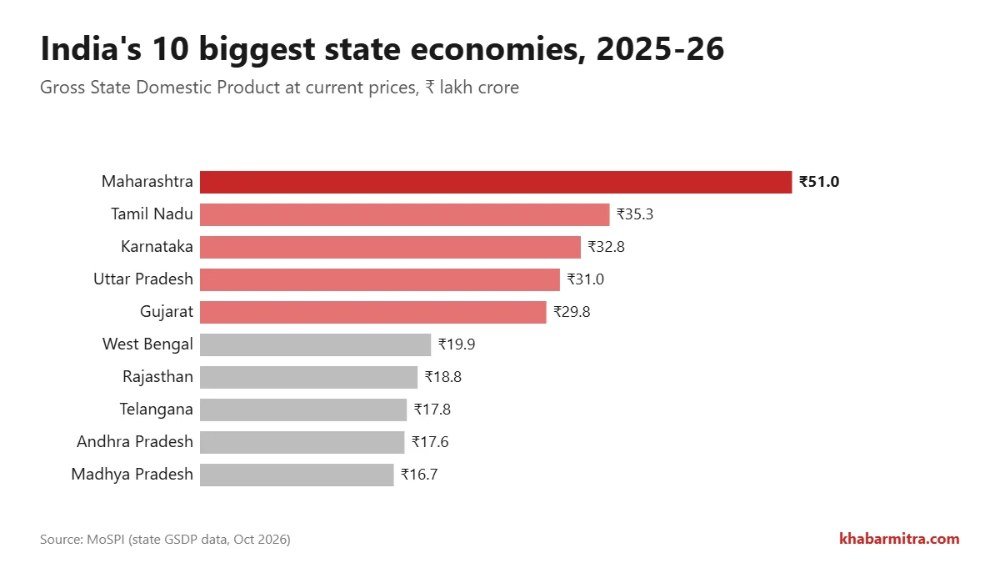
A caution on Uttar Pradesh: its published 2025-26 figure shows just 2.5% growth, far below every other big state. That looks like a data revision issue rather than a real slowdown, so treat UP’s ranking as provisional until MoSPI publishes its full series.
2. The growth story is in the south
Size is one thing; speed is another. After adjusting for inflation, the fastest-growing large economies in 2025-26 were:
- Tamil Nadu: 10.8%. Manufacturing-led, and now the clear #2 economy.
- Assam: 10.1%. Just outside the top 15 by size, but the standout in the east.
- Andhra Pradesh: 9.9%.
- Haryana: 9.5%.
- Rajasthan and Bihar: 8.7% each.
Maharashtra grew a solid 7.9%. That’s slower than most of its rivals, but on a much bigger base. The full ranking is below.
| # | State | GSDP 2025-26 (₹ lakh cr) | Real growth | Share |
|---|---|---|---|---|
| 1 | Maharashtra | 51.01 | 7.9% | 14.3% |
| 2 | Tamil Nadu | 35.29 | 10.8% | 9.9% |
| 3 | Karnataka | 32.81 | 8.1% | 9.2% |
| 4 | Uttar Pradesh | 31.01 | n/a | 8.7% |
| 5 | Gujarat | 29.84 | 8.6% | 8.4% |
| 6 | West Bengal | 19.91 | 7.6% | 5.6% |
| 7 | Rajasthan | 18.75 | 8.7% | 5.3% |
| 8 | Telangana | 17.82 | 8.5% | 5.0% |
| 9 | Andhra Pradesh | 17.62 | 9.9% | 4.9% |
| 10 | Madhya Pradesh | 16.70 | 8.0% | 4.7% |
| 11 | Kerala | 14.27 | n/a | 4.0% |
| 12 | Haryana | 13.68 | 9.5% | 3.8% |
| 13 | Bihar | 11.07 | 8.7% | 3.1% |
| 14 | Odisha | 9.88 | 7.9% | 2.8% |
| 15 | Punjab | 8.91 | n/a | 2.5% |
3. Bigger isn’t richer
Uttar Pradesh has the fourth-largest economy but one of the lowest incomes per person, because that output is shared among more than 24 crore people. Per capita income tells a very different story from the GSDP ranking.
The average person in Delhi earns about seven times as much as the average person in Bihar.
| State/UT | Per capita income 2024-25 | Growth | |
|---|---|---|---|
| Highest | |||
| 1 | Delhi | ₹4,93,024 | +7.3% |
| 2 | Telangana | ₹3,87,623 | +11.5% |
| 3 | Karnataka | ₹3,80,906 | +12.1% |
| 4 | Tamil Nadu | ₹3,61,619 | +15.4% |
| 5 | Haryana | ₹3,53,182 | +10.6% |
| Lowest | |||
| 22 | Madhya Pradesh | ₹1,52,615 | +9.2% |
| 23 | Jharkhand | ₹1,16,663 | +9.5% |
| 24 | Uttar Pradesh | ₹1,08,572 | +11.5% |
| 25 | Bihar | ₹69,321 | +11.4% |
Not in the table: Sikkim (about ₹5.88 lakh) and Goa (about ₹5.86 lakh) were ahead of Delhi on their latest 2023-24 data, but haven’t published 2024-25 figures yet.
The encouraging part: incomes rose 9–15% almost everywhere, and the poorest states are growing about as fast as the richest. The gap isn’t widening, but at this pace it won’t close soon either.
4. Jobs are the weak spot
Growth hasn’t fully translated into work, especially for young people. According to the government’s Periodic Labour Force Survey:
- Overall unemployment was 5.1% in July–September 2026, down from 5.4% the quarter before.
- Youth unemployment was 15.9% in April–June 2026, up from 14.6% a year earlier. Roughly one in six young people looking for work can’t find it.
- Gujarat had the lowest unemployment of any state (2.2%) in the 2025 quarterly surveys. Rajasthan (8.8%) and Uttarakhand (8.9%) had the highest.
You may see state unemployment rates of 20% or more quoted online. Those usually come from private surveys with different definitions, and aren’t comparable with official PLFS figures.
India, region by region
- West: the industrial and financial core. Maharashtra leads on size; Gujarat pairs strong growth with India’s lowest unemployment.
- South: the growth engine. Manufacturing in Tamil Nadu and IT in Karnataka and Telangana, plus four of the seven highest incomes.
- North and centre: a split picture. Delhi and Haryana are wealthy, while Uttar Pradesh and Madhya Pradesh are large but low-income.
- East and Northeast: the lowest incomes, but Assam’s growth and Bihar’s steady catch-up are the bright spots.
India’s economy at a glance
| Real GDP growth, 2025-26 | 7.7% (later revised to 7.8%) |
| Real GDP growth, 2024-25 | 7.1% |
| Nominal GDP, 2025-26 | ₹346.36 lakh crore (+8.9%) |
| Growth in April–June 2026 | 7.8% |
Frequently asked questions
Which is the richest state in India?
By total economy size, Maharashtra. By average income per person, Sikkim and Goa lead on the latest available data, followed by Delhi.
Which is the poorest state in India?
Bihar, with a per capita income of about ₹69,000 a year in 2024-25. It’s growing at more than 11% a year in nominal terms.
What is the difference between GDP and GSDP?
GDP measures the whole country’s output; GSDP (Gross State Domestic Product) measures one state’s. They’re calculated in a similar way, but state data is published later and revised more often.
Why don’t the state figures add up to India’s GDP?
In 2026, MoSPI moved national GDP to a new base year (2022-23), while state GSDP is still published on the older 2011-12 base. That’s why the shares in this article are calculated against the total of all states, not national GDP.
Sources and how we calculated this
- National GDP: MoSPI Provisional Estimates of GDP 2025-26 and the PIB note on Q1 2026-27 GDP
- State GSDP: MoSPI National Accounts, via StatisticsTimes (updated 13 October 2026)
- Per capita income: RBI Handbook of Statistics on Indian States, via India in Data
- Jobs: PLFS Quarterly Bulletin, April–June 2026 and the 2025 quarterly bulletins
- Real growth rates and shares are calculated by Khabar Mitra from the published figures.
Spotted an error? Tell us and we’ll correct it. We update this page whenever new state data is released.
Discover more from Khabar Mitra
Subscribe to get the latest posts sent to your email.