
Bihar, India’s third most populous state, presents a complex demographic landscape shaped by distinctive caste compositions, significant development challenges, and unique socio-economic patterns. Based on the groundbreaking 2023 Bihar Caste Census and recent demographic surveys, this analysis reveals profound insights into the state’s social structure, economic indicators, and developmental trajectories that have critical implications for policy planning and social justice initiatives.
Population Profile and Basic Demographics
Bihar’s population has reached approximately 130.7 million as of 2023, representing 9.1% of India’s total population. The state exhibits several distinctive demographic characteristics that set it apart from national averages. With a population density of 1,388 persons per square kilometer, Bihar ranks as India’s most densely populated state, significantly exceeding the national average of 464 persons per square kilometer.
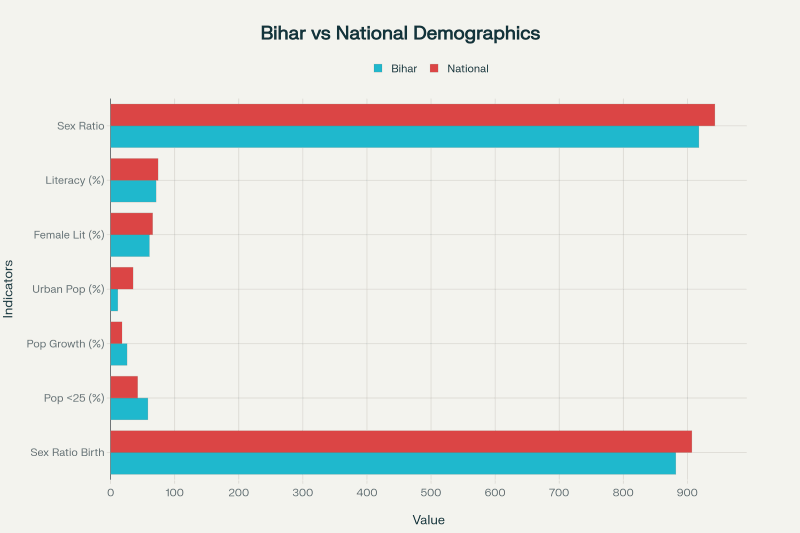
Comparison of key demographic indicators between Bihar and national averages highlighting development challenges
The state’s rural character remains pronounced, with 89% of the population residing in rural areas compared to the national average of 65%. This overwhelming rural concentration reflects limited urbanization, with only 11% urban population against the national average of 35%. The sex ratio stands at 918 females per 1000 males, below the national average of 943, indicating persistent gender disparities.
Bihar’s population is remarkably young, with 58% of residents under 25 years of age – the highest proportion among all Indian states. This demographic dividend potential is accompanied by a high fertility rate of 3.41 children per woman, substantially above the national average of 2.0. However, the sex ratio at birth has declined alarmingly to 882 females per 1000 male births in 2023-24, representing one of India’s worst performing indicators.
Comprehensive Caste Composition Analysis
The 2023 Bihar Caste Census provides unprecedented insights into the state’s social composition, revealing patterns that challenge conventional assumptions about caste demographics in India. This comprehensive survey, covering 13.07 crore (130.7 million) people, represents the most detailed caste enumeration conducted by any Indian state in recent decades.
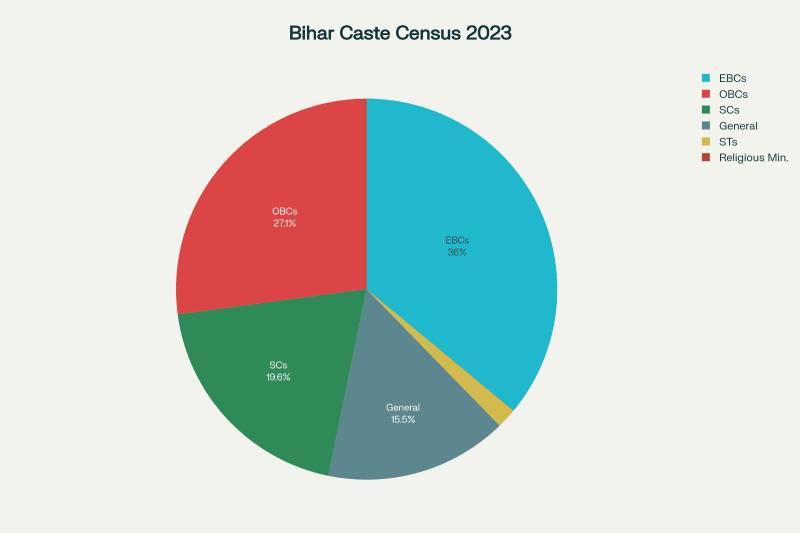
Caste composition of Bihar state based on 2023 Bihar Caste Census showing distribution across major social categories
Major Caste Categories
Extremely Backward Classes (EBCs) constitute the largest demographic segment at 36.01% of the population, comprising approximately 47.08 million people. This category includes numerous marginalized communities historically excluded from mainstream development processes. Other Backward Classes (OBCs) account for 27.12% of the population, totaling 35.46 million people. Together, EBCs and OBCs represent 63.13% of Bihar’s population, forming a substantial majority.
Scheduled Castes (SCs) comprise 19.65% of the population, representing 25.68 million people. This significant proportion reflects Bihar’s historical social stratification patterns. The General Category (traditionally considered “upper castes”) accounts for only 15.52% of the population, totaling 20.29 million people. This finding challenges traditional perceptions of caste influence in Bihar’s social hierarchy.
Scheduled Tribes (STs) represent 1.68% of the population at 2.20 million people, while religious minorities constitute 0.02%. The relatively small ST population reflects Bihar’s geographic location outside major tribal concentration areas.
Dominant Caste Groups
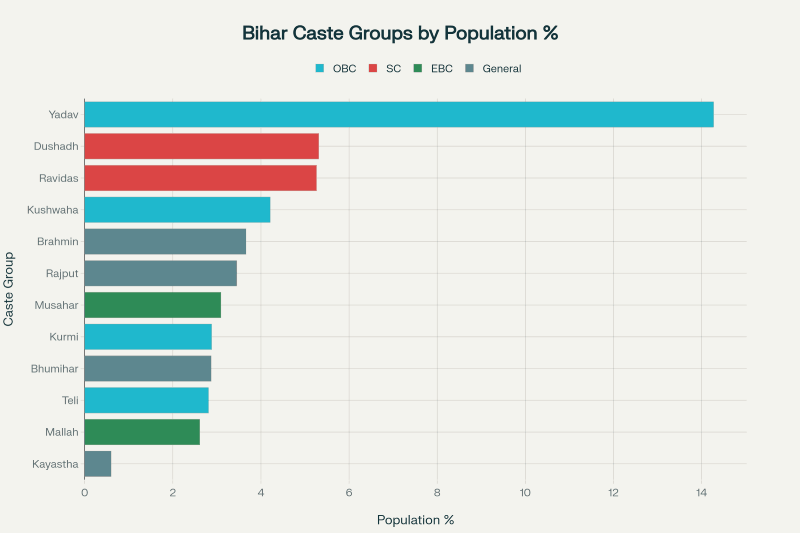
Major caste groups in Bihar by population percentage, showing the dominance of Yadavs and significant representation of various castes across categories
The Yadav community emerges as Bihar’s single largest caste group at 14.27% of the population, representing approximately 18.65 million people. This substantial presence explains the community’s significant political influence in state politics. Dushadh (5.31%) and Ravidas (5.26%) represent the largest Scheduled Caste communities. Among OBCs, Kushwaha/Koeri (4.21%), Kurmi (2.88%), and Teli (2.81%) constitute major groups.
Among General Category communities, Brahmins (3.66%), Rajputs (3.45%), and Bhumihars (2.87%) represent the largest upper caste populations. The Kayastha community, despite high socio-economic status, comprises only 0.60% of the population, illustrating the complex relationship between numerical strength and social influence.
Educational Development and Literacy Patterns
Bihar’s literacy landscape reveals significant regional disparities and gender gaps. The overall literacy rate of 70.9% remains below the national average of 74.0%, with male literacy at 79.7% and female literacy at 60.5%. Recent improvements show the literacy rate increased from 61.8% in the 2011 census to 70.9% by 2017, representing substantial progress.
District-wise analysis reveals stark educational inequalities. Rohtas district leads with 73.37% literacy, followed by Patna (70.68%) and Bhojpur (70.47%). Conversely, northern and eastern districts lag significantly, with Purnia recording the lowest literacy at 51.08%. The literacy gap between highest and lowest performing districts spans 22.29 percentage points, indicating severe intra-state disparities.
Rural-urban literacy differences remain pronounced. Urban areas achieve 83.1% literacy compared to 69.5% in rural areas. Female literacy shows even starker disparities, with urban women at 75.9% versus rural women at 58.7%. These patterns reflect limited educational infrastructure in rural areas and persistent gender discrimination in educational access.
Economic Structure and Development Indicators
Bihar’s economy demonstrates rapid growth despite structural challenges. The Gross State Domestic Product (GSDP) grew by 9.2% in 2023-24 at constant prices, ranking fourth highest among Indian states. At current prices, GSDP reached ₹8.54 lakh crore with a growth rate of 14.5%.
However, per capita income remains critically low. In 2023-24, per capita income was ₹66,828 at current prices and ₹36,333 at constant prices. This represents only 36.3% of the national per capita income, positioning Bihar at the bottom among all Indian states. Patna district has the highest per capita GSDP at ₹1,14,541, while Sheohar records the lowest at ₹18,980.
Sectoral composition reveals service sector dominance. Services contribute 58.6% to GSDP, industry accounts for 21.5%, and agriculture represents 19.9%. Despite economic growth, 49.6% of workers remain engaged in agriculture, indicating limited economic diversification. Female labor force participation stands at only 13% – the lowest among all Indian states.
Migration Patterns and Demographics
Bihar experiences massive out-migration, fundamentally shaping its demographic profile. Approximately 18.8% of rural Bihar’s population are migrants, with 85.2% being male. Between 2001 and 2011, around 9.3 million people migrated from Bihar. Male migration is predominantly work-related (91.2%), while female migration primarily involves marriage.
Migration destinations reveal economic geography patterns. More than 90% of migrants move to other states, with Punjab, Delhi, and Haryana accounting for about half. Maharashtra (10.3%) and Gujarat (6.1%) serve as important western destinations. This massive out-migration partially explains Bihar’s skewed sex ratio and rural population concentration.
Gender Disparities and Social Challenges
Gender inequality permeates multiple dimensions of Bihar’s social fabric. The declining sex ratio at birth (882 in 2023-24) indicates widespread female foeticide, placing Bihar among India’s worst-performing states. Child sex ratio at 935 remains above the national average but shows declining trends.
Healthcare access reveals gender bias. Female infants have higher mortality rates and lower odds of receiving medical care when ill. Female children show lower rates of facility-based care and postnatal checkups. These patterns contribute to excess female mortality and persistent sex ratio imbalances.
Economic participation remains severely limited for women. Only 13% of women who worked in the previous year received cash payments, significantly below the national average of 25.4%. This reflects both limited employment opportunities and unpaid domestic labor burdens.
Regional and Social Disparities
Caste-based economic disparities persist across communities. Kayasthas record the lowest poverty rates at 13.38% despite small population size, while Musahars face extreme poverty at 64.07%. Scheduled Castes and Tribes experience high poverty rates of 42.93% and 42.7% respectively. Among OBCs, Yadavs have lower poverty (30.49%) compared to Kushwahas (47.11%).
Geographic disparities compound social inequalities. Northern and eastern districts consistently underperform in literacy, healthcare, and economic indicators. Proximity to Patna and southern districts correlates with better development outcomes, reflecting infrastructure and administrative advantages.
Migration and Demographic Transition
Bihar’s migration patterns create complex demographic dynamics. Natural population growth exceeds out-migration losses, enabling continued population expansion despite massive emigration. Fertility rates remain high while substantial working-age male populations migrate, creating unique age and gender structures.
Migration serves as livelihood strategy for marginalized communities, particularly agricultural laborers and lower castes. Upper castes and economically better-off families migrate to urban destinations, while marginalized groups often move to rural areas for agricultural work. These patterns reproduce existing inequalities at destination locations.
Policy Implications and Development Challenges
The demographic and caste composition data reveals critical policy priorities. The dominance of OBCs and EBCs (63.13%) alongside substantial SC populations (19.65%) suggests reservation policies must address numerical realities. Traditional upper castes’ minority status (15.52%) requires recalibrating political and economic power structures.
Educational infrastructure demands urgent attention, particularly in northern and eastern districts where literacy lags significantly. Gender-focused interventions are essential given alarming sex ratio trends and low female literacy rates. Economic diversification beyond agriculture is crucial for absorbing the growing youth population.
Healthcare system strengthening must address gender bias in medical care and rural-urban disparities. Female foeticide prevention requires both legal enforcement and social awareness campaigns. Women’s economic empowerment through skill development and employment generation could transform gender dynamics.
Conclusion
Bihar’s demographic and caste composition analysis reveals a state undergoing complex social and economic transitions. The 2023 Caste Census provides unprecedented insights into social hierarchies, challenging conventional assumptions about caste demographics. The dominance of OBCs and EBCs requires policy frameworks that address the needs of these numerically significant but historically marginalized communities.
Despite impressive economic growth rates, Bihar faces fundamental development challenges including low per capita income, limited urbanization, educational disparities, and severe gender inequalities. The state’s young demographic profile offers potential advantages but requires massive investments in education, healthcare, and employment generation.
Addressing these challenges requires comprehensive strategies that acknowledge caste-based inequalities, regional disparities, and gender discrimination. Bihar’s experience provides crucial insights for understanding India’s ongoing social transformations and the complex relationships between demography, caste, and development in contemporary India. Effective governance must leverage detailed demographic understanding to create inclusive policies that harness Bihar’s human capital while addressing historical disadvantages and emerging challenges.